


Ask ten people at a Delhi metro station what ₹5,000 a month in a SIP becomes in 20 years at 12 per cent, and most will guess ₹12 lakh, which is the amount they put in. The actual figure is close to ₹50 lakh. The gap between the two numbers is the entire case for financial infographic design. Nobody can feel compounding by reading a formula. They can see it in a curve that starts flat and bends upward, if the curve is drawn to scale.
- Why do finance explanations fail even when the numbers are right?
- Which six chart types work for financial communication, and which three mislead?
- How should a SIP growth curve be drawn?
- How do you explain NAV without making it look like a score?
- What is the right way to show an EMI breakup?
- How should insurance benefit illustrations be visualised?
- What compliance overlay does every financial infographic need?
- Concept to visual pattern: the working table
- What do accessibility and contrast require in financial infographic design?
- How does a social-first infographic differ from print?
- People also ask
Why do finance explanations fail even when the numbers are right?
Three properties of financial ideas make them hard to hold in the head.
- Abstraction. A NAV of ₹47.32 is not a price a person can compare with anything they buy. A 1.2 per cent expense ratio is a number with no reference point. Readers cannot judge a number until it sits next to something they know.
- Compounding. Human intuition is linear. Twenty years of 12 per cent growth feels like 20 times 12, or 240 per cent, when it is closer to 860 per cent. A visual corrects it because the reader sees the bend rather than calculating it.
- Percentages of percentages. “A 1 per cent higher expense ratio reduces your corpus by roughly 20 per cent over 25 years” is true and unbelievable. Two lines diverging over time show it in a second.
In 320+ BFSI projects since 2017, we have seen the same explainer fail as text and succeed as a single chart, without changing a number.
Which six chart types work for financial communication, and which three mislead?
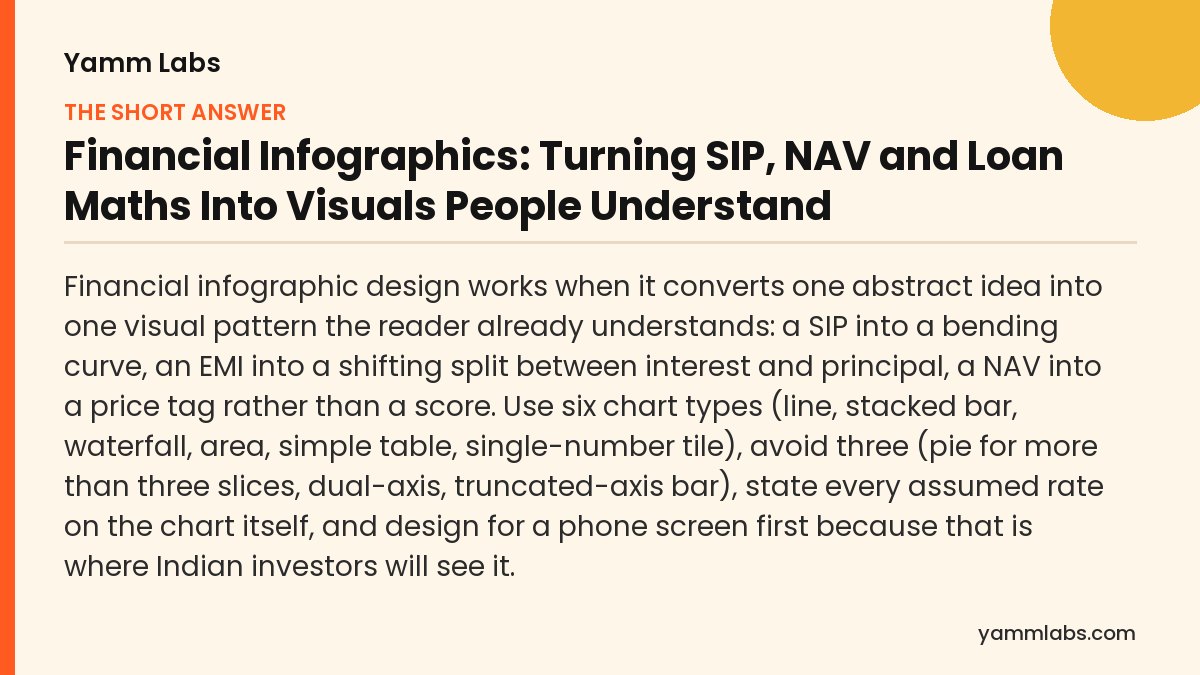
The six below cover almost every concept an AMC, insurer, lender or broker needs to explain. The three after them appear constantly and should not.
The six that work
- Line chart over time. The default for growth, NAV history and the SIP curve. One line for the concept, one neutral line for the comparison.
- Stacked bar. The EMI breakup (interest versus principal), a portfolio’s asset allocation, a premium’s split between mortality charge and investment. Two or three segments, labelled on the bar.
- Waterfall. How a gross return becomes a net return after expense ratio, exit load and tax. How a salary becomes take-home.
- Area chart. The SIP corpus split into “what you invested” and “what it earned”. The growing wedge of earnings is the single most persuasive image in retail investing.
- Simple table. When there are more than five numbers, or when the reader needs to compare two options exactly, a table beats any chart. Performance versus benchmark, term plan premiums across ages, loan tenures against EMI.
- Single-number tile. One large figure with its unit, its date and its assumption. “₹49.9 lakh. ₹5,000 a month for 20 years at an assumed 12 per cent.”
The three that mislead
- Pie chart with more than three slices. A twelve-sector portfolio pie is unreadable and, on a phone, illegible. Use a sorted horizontal bar.
- Dual-axis chart. NAV on the left axis and AUM on the right, or price and returns on two scales, invites the reader to see a relationship that the designer chose by scaling. Split it into two charts.
- Truncated-axis bar. A bar chart of returns where the axis starts at 10 per cent makes a 12 per cent fund look twice as tall as an 11 per cent one. Under SEBI’s advertisement code this is also a fair-representation problem, not just a design one. Start at zero or use a table.
SIGNALNewsletter by Yamm Labs
The next piece, straight to your inbox.
New writing on BFSI brands, B2B and influencer marketing, and AI search.
One click to unsubscribe. Privacy policy

How should a SIP growth curve be drawn?
The SIP curve is the most reproduced financial infographic in India, from SBI MF’s investor education to Groww’s app screens. Most versions are drawn to impress rather than to inform. Rules that keep it honest:
- Show the invested amount as its own area. The flat, linear wedge of contributions makes the compounding wedge visible by contrast. Without it the reader sees a curve, not a comparison.
- Put the assumed rate on the chart. Not in a footnote. “Assumed 12 per cent annual return, for illustration only” sits under the title. Regulators require it, and it is what makes the chart credible.
- Use two rates, not one. A 10 per cent and a 12 per cent line, or 8 and 12, shows the reader that the outcome is a range. A single line implies a promise.
- Mark the years, not just the end. Labels at 5, 10, 15 and 20 years let the reader locate their own horizon. The bend between 10 and 20 is the lesson.
- Keep the y-axis in rupees the reader uses. Lakh and crore, not millions. “₹49.9 lakh” reads instantly; “₹4.99M” does not, to most Indian readers.
How do you explain NAV without making it look like a score?
The most common retail misconception in Indian mutual funds is that a fund with a NAV of ₹15 is cheaper, and therefore better value, than one with a NAV of ₹450. A NAV is a unit price; returns depend on the change in that price, not its level. An infographic that fixes this has to do one thing: show two funds with different NAVs delivering the same return on the same ₹10,000.
- Use the “same ₹10,000” frame. ₹10,000 buys 666 units at ₹15 or 22 units at ₹450. If both grow 10 per cent, both are worth ₹11,000. Two columns, same end number.
- Separate NAV history from returns. A NAV line chart shows price movement. Putting NAV and returns on one chart is the dual-axis error above. Show the NAV line, then state the CAGR as a tile below it, with the period and the benchmark.
- Always pair returns with the benchmark. A fund’s 14 per cent means nothing until the reader sees the benchmark’s 12 or 16. SEBI requires this in advertising; it is also the only way the number has meaning.
What is the right way to show an EMI breakup?
Borrowers on a ₹30 lakh home loan at 8.5 per cent over 20 years pay an EMI of about ₹26,000 and, in the first year, close to 80 per cent of it goes to interest. Most borrowers do not know this. It is the most useful thing an infographic can teach about a loan.
- Stacked bars by year. Twenty bars, each the year’s total payment, split into interest and principal. The reader sees why prepaying in year three matters more than in year fifteen.
- Total cost tile. “You borrow ₹30 lakh. You repay about ₹62 lakh.” One tile, two numbers, unit and assumption. This is the honest frame, and it builds more trust than hiding it.
- State the rate as the rate. “8.5 per cent per annum, reducing balance” not “starting from 8.5 per cent*”. If the rate is floating, say so on the chart.
How should insurance benefit illustrations be visualised?
IRDAI requires a benefit illustration for savings and unit-linked policies showing the maturity and death benefit at assumed gross investment returns of 4 per cent and 8 per cent, alongside the charges. The infographic’s job is to make that table understandable, not to replace it.
- Show the two scenarios side by side as bars, not as one optimistic line. The 4 per cent bar next to the 8 per cent bar, both labelled “assumed, not guaranteed”, teaches the reader that the outcome is a range.
- Separate the guaranteed from the non-guaranteed. Where a plan has a guaranteed component, draw it as a solid segment and the non-guaranteed as a hatched or lighter segment.
- Put the premium next to the benefit. “You pay ₹1 lakh a year for 10 years. At 8 per cent assumed, you could receive about ₹X at year 20.”
- Show charges as a waterfall. Premium, minus mortality and allocation charges, equals invested amount.
What compliance overlay does every financial infographic need?
Every chart that shows a future number is an illustration and has to be labelled as one. The overlay below is built as locked components on our templates for AMC, insurer and lender clients. Our guide to SEBI, IRDAI and RBI advertising rules covers the underlying requirements.
- Assumed rate, on the chart. “Assumed 12 per cent per annum” or “at 4 per cent and 8 per cent gross returns as required by IRDAI”, placed directly under the title or on the axis.
- “For illustration only” label. Adjacent to the assumption.
- The product’s standard disclaimer. Mutual fund investments are subject to market risks, read all scheme related documents carefully; or the IRDAI-mandated wording for insurance; in a legible size, in a fixed strip.
- Riskometer where a scheme is named. If a chart names a scheme, it carries the riskometer. If it names only a category or an assumed rate, it usually does not.
- Past performance in the prescribed format. If a chart shows actual past returns of a scheme, it uses the standard periods, shows the benchmark, and is dated.
- No guaranteed language on a non-guaranteed product. “Could grow to”, “may be worth”, “illustrative value”. Never “will become”.
Concept to visual pattern: the working table
| Concept to explain | Visual pattern | Comparison that makes it land | Compliance element |
|---|---|---|---|
| SIP compounding | Area chart, invested versus earned | Two assumed rates, years marked | Assumed rate, illustration label, disclaimer |
| NAV versus returns | Two columns, same ₹10,000 | Low-NAV and high-NAV fund with identical growth | Category-level, no scheme named, or riskometer if named |
| Expense ratio impact | Two diverging lines over 20 years | 1 per cent versus 2 per cent expense | Assumed return, illustration label |
| Fund versus benchmark | Simple table, standard periods | Scheme, benchmark, additional benchmark | SEBI performance format, date, riskometer |
| EMI interest versus principal | Stacked bar by year | Year 1 versus year 15 split | Rate, tenure, reducing balance stated |
| Total cost of a loan | Single-number tile, two figures | Amount borrowed versus amount repaid | Rate, tenure, processing fee stated |
| Prepayment benefit | Two lines, outstanding balance | With and without annual prepayment | Assumptions on chart, no “save ₹X” without them |
| Insurance benefit illustration | Side-by-side bars at 4 and 8 per cent | Guaranteed solid, non-guaranteed hatched | IRDAI prescribed table alongside, “not guaranteed” |
| ULIP charges | Waterfall | Premium to invested amount | Charge names as in the policy document |
What do accessibility and contrast require in financial infographic design?
A chart that a reader with red-green colour deficiency cannot parse fails roughly one in twelve men, and a chart that needs a 1,200-pixel screen fails most Indian investors.
- Never encode meaning with colour alone. Label each series directly on the chart. Use a solid and a dashed line, or a solid and a hatched area, in addition to two colours.
- Contrast at 4.5:1 for text, 3:1 for chart elements. Pale grey axis labels and light brand tints as fills fail this.
- Minimum 12-pixel text on screen, 8-point in print, including the assumption and the disclaimer. A disclaimer too small to read is a compliance problem.
- Numbers in the reader’s format. Indian grouping (₹1,00,000), lakh and crore, per cent written out or as a symbol consistently.
Colour choices for financial brands carry their own meaning, which we cover in colour psychology for financial brands; for charts the priority is contrast and consistency over expression.
How does a social-first infographic differ from print?
The same concept needs two designs, not one resized.
- Social: one number, one curve, one sentence. A 1080 x 1350 Instagram post or a 1080 x 1920 story holds a single-number tile or a single chart. The assumption sits under the number. The disclaimer sits in a fixed strip. The caption carries the explanation. Carousels split a concept into one idea per card.
- Print and PDF: the full argument. An A4 investor-education sheet or a factsheet page can carry the chart, the table beneath it, the assumptions in full and the prescribed disclaimer block.
- Video: the curve should move. A 20-second animation of the SIP area chart growing, with the year counter ticking, teaches compounding better than any static frame. Our post on fintech explainer videos covers the format; the disclaimer needs its required on-screen duration.
- The rule that does not change. Every version, from a story frame to a printed sheet, carries the assumed rate and the illustration label in a readable size.
A reader cannot calculate compounding, but they can see it bend. Draw the bend, and put the assumption next to it.
People also ask
What is the best chart to explain SIP returns?
An area chart over time with two layers: the amount invested, which grows in a straight line, and the value of the investment at an assumed return, which curves upward. Show two assumed rates rather than one, label the years, and put the assumed rate and “for illustration only” directly under the title.
Can a mutual fund infographic show projected returns?
Only as an illustration at a clearly stated assumed rate, labelled as such, with the standard disclaimer, and without language that implies a guarantee. If a specific scheme is named, the riskometer must appear and any actual past performance must follow SEBI’s prescribed format with the benchmark.
Why is a pie chart a poor choice for portfolio allocation?
Readers judge angles poorly, and a pie with more than three slices becomes unreadable on a phone. A sorted horizontal bar chart with labelled values shows the same allocation more accurately, in less space, and remains legible in greyscale.
What does IRDAI require in an insurance benefit illustration?
For savings and unit-linked life insurance products, the insurer must provide a benefit illustration showing the benefits at assumed gross investment returns of 4 per cent and 8 per cent, along with the charges, in a prescribed format. A visual can make this table easier to understand but cannot replace it or show only the higher scenario.
Sources
If your SIP explainer has one line and no assumed rate, it is persuading the wrong way.
Get a free Fintech Brand Audit across 8 dimensions, plus 3 fixes. No pitch. Run the free Brand Audit →